resources
MEJ’s Maps
Indicator Descriptions for Colorado Demonstration Map
MEJ’s demonstration map of Colorado includes 20 indicators covering environmental, public health, and socioeconomic information.
Issues related to EJ
Climate Change and Environmental Justice
The impacts of climate change, both present and future, disproportionately fall on environmental justice communities. While environmental impacts and climate change do not always completely overlap, climate change’s effects, such as increased storm activity and temperatures, are far more harmful to low-income communities of color.
Criminalization of Homelessness and Environmental Injustices
Individuals living on the streets are more exposed to environmental hazards. When living outside is criminalized and these communities are forced to move from safe to risky spaces, they are often further exposed to environmental toxics. This national study finds that individuals living on the streets and without homes are much more exposed to soil and water contamination, air and noise pollution, and extreme weather events (land slides, hurricanes, tornadoes, floods, wildfires, etc.)
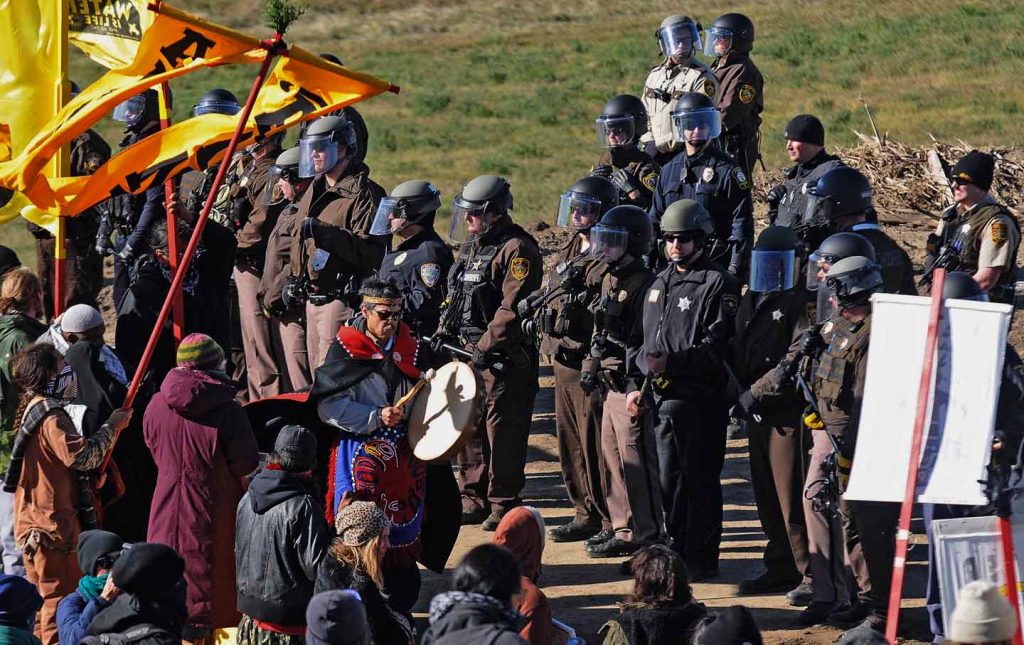
Police Violence and Environmental Justice
The history of the environmental justice movement has been interconnected with police violence and use-of-force. Today, environmental justice communities are the same communities that police target with violence and over-policing.
Cannabis Industry
The cannabis industry can have air quality, energy, waste disposal, and water quality impacts on neighborhoods in which facilities are located. Similar to other industries being sited in communities and near schools, cannabis facilities can have negative impacts on the people who live near them. Local zoning and regulations can exacerbate these impacts for low-income communities of color.
Other maps
U.S. Environmental Protection Agency’s EJSCREEN
The U.S. Environmental Protection Agency has its own environmental justice screening and mapping tool to help protect public health and environment. While the map provides national data, it does not provide the granularity, community input, and accessibility of more local, state-based efforts. The map is also not intended to be used as a decision-making tool and does not assess cumulative impacts.
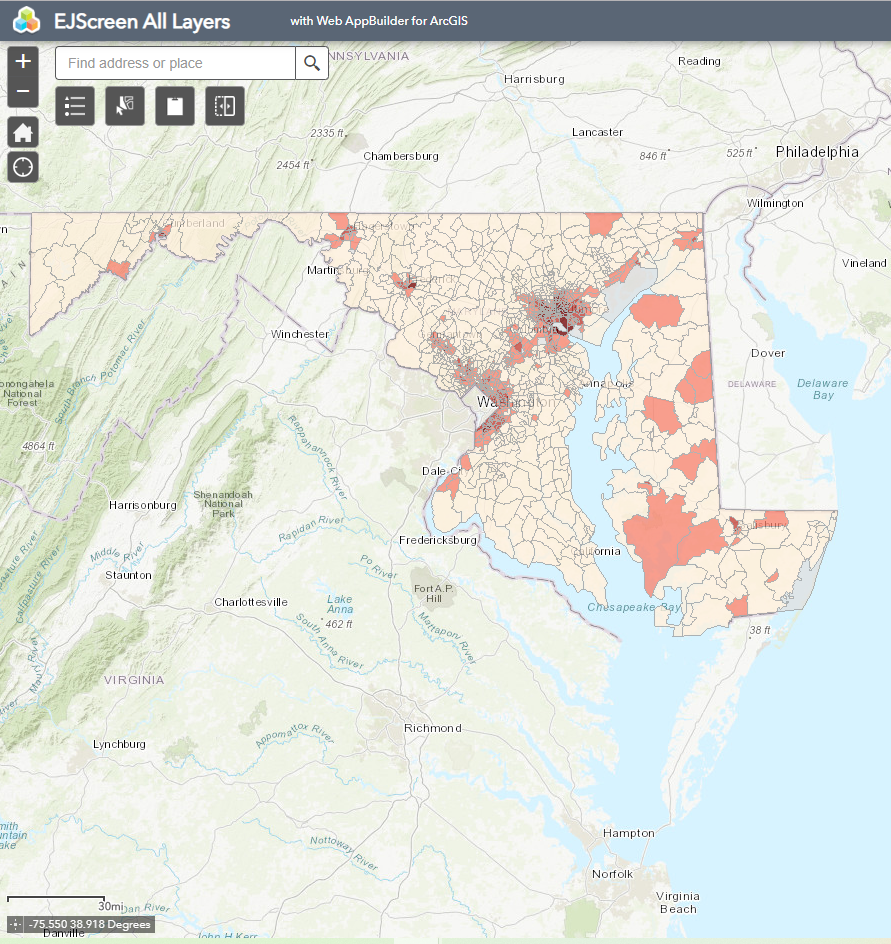
Maryland’s Environmental Justice Screening App
The Maryland Environmental Justice Screen application combines demographic and environmental health data from a variety of sources and maps that data onto Maryland census tracts in order to identify “disadvantaged communities.”
Illinois Solar for All’s Environmental Justice Communities
The Illinois Power Agency and Elevate Energy have identified environmental justice communities by replicating the CalEnviroScreen framework and adapting to the state of Illinois. Additionally, groups or individuals may also submit a proposal to request that their community be designated as an environmental justice community.
University of Michigan Screening Tool for Environmental Justice
A beta-version of an environmental justice screening tool for the state of Michigan.
California
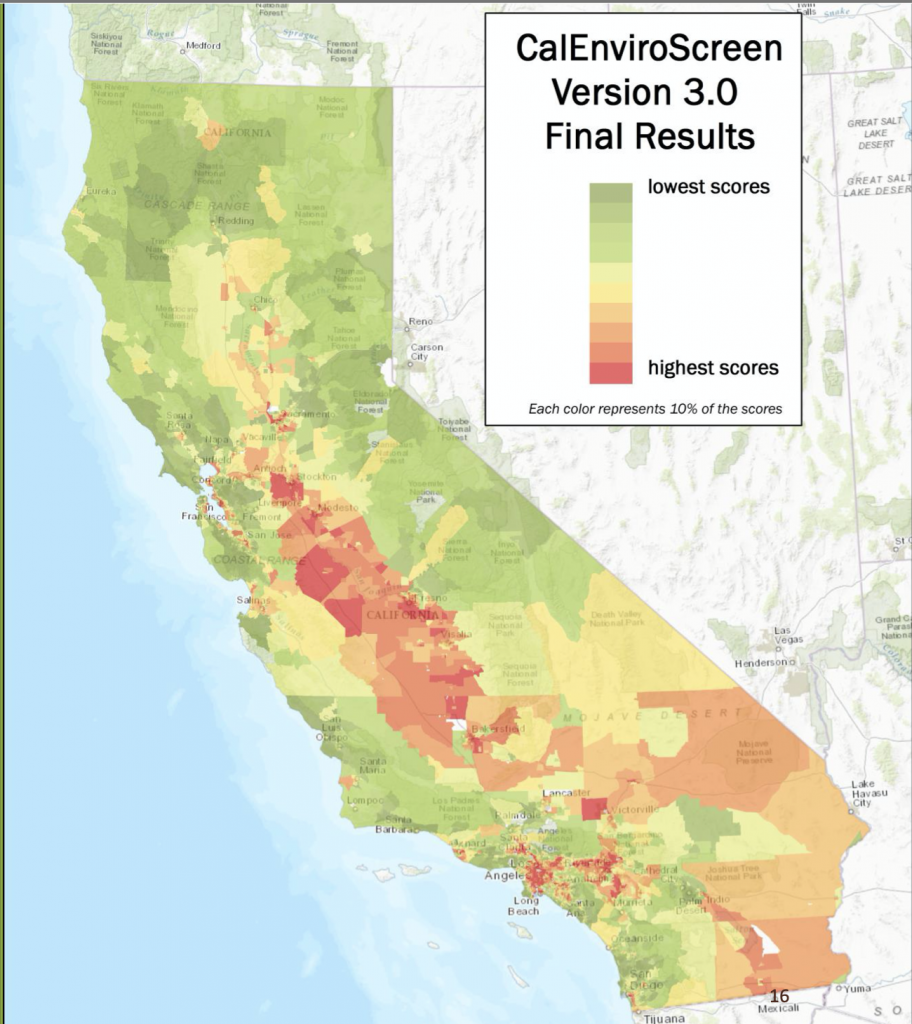
CalEnviroScreen
California’s CalEnviroScreen was created in 2013 and is currently in its 3rd version (released 2018). The map is used in key decision-making throughout the state, including targeting investment of proceeds from California’s cap-and-trade program (AB 32).
California’s definition of “Disadvantaged Communities”
Defining ‘disadvantaged communities’ has allowed policymakers to target interventions towards the communities most impacted by environmental racism. Policy applications have included requirements that a portion of proceeds from California’s cap-and-trade program benefit disadvantaged communities (SB 535 and AB 1550), providing the Department of Toxic Substances Control with a tool for assessing cumulative impacts when making permitting decisions (SB 673), and requirements that cities/counties with disadvantaged communities incorporate environmental justice goals into their General Plans (SB 1000).
California Environmental Justice Alliance’s SB 1000 Implementation Toolkit
The SB 1000 Implementation Toolkit, prepared collaboratively by California Environmental Justice Alliance and PlaceWorks Inc., is a guidance document intended for local governments, planners, community-based organizations, and other stakeholders who will be working to develop an Environmental Justice Element or a set of environmental justice policies for their General Plans. The toolkit also provides best practices for promoting meaningful community engagement throughout the EJ planning process.
Colorado
Colorado Bicycle & Byways Map
Urban environmental justice neighborhoods are often characterized by streets that cater more to large trucks and heavy-moving vehicles than to community members’ transportation needs. For community members who bike as their mode of local transportation, the lack of safe bike lanes pose a major risk. Lack of access to bike lanes and safe street infrastructure leads to bike-vehicle accidents and the inability of community members to get from point A to point B. The Colorado Bicycle and Byways Map highlights areas with safe bike transportation options and provides bike routes and trails and truck traffic in Colorado.
Colorado Climate & Environment-Related Court Cases
While many environmental injustices go unlitigated, this link provides a small overview of current and past litigation related to the environment and climate in Colorado.
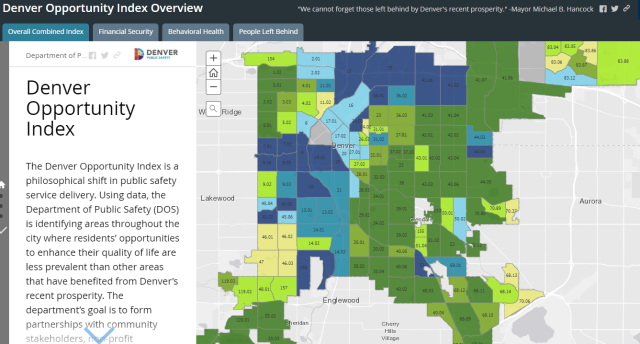
Denver Opportunity Index
The Denver Opportunity Index identifies areas throughout Denver where residents’ opportunities to enhance their quality of life are less prevalent than other areas that have benefited from Denver’s recent prosperity. The map brings together three types of data — Financial Security, Behavioral Health, and People Left Behind — to create a composite score of Denver census tracts on a scale of 1 to 6.
Denver Odor Complaints
Environmental justice communities often experience large amounts of pollution due to the siting of polluting industries in their neighborhoods. In Denver, there are various industries that pollute close to people’s homes and schools, including industries that produce strong odors affecting residents’ health and quality of life. This article provides an ongoing repository of odor complaints in Denver.
Washington
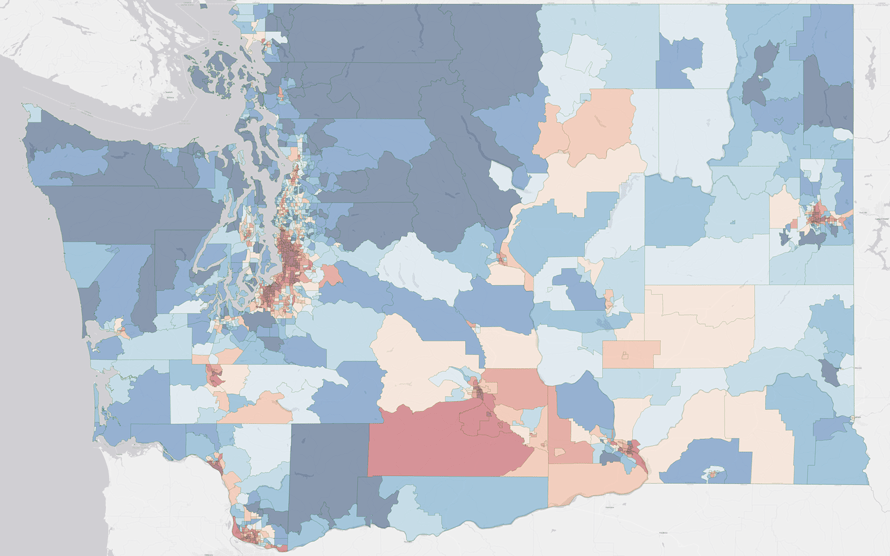
Washington’s Environmental Health Disparities Map
Washington’s Environmental Health Disparities Map was created in 2018 and modelled after CalEnviroScreen to provide a cumulative environmental health impact score for each census tract reflecting pollutant exposures and factors that affect people’s vulnerability to environmental pollution.
Front and Centered Pollution Listening Sessions
In 2017, Front and Centered conducted community listening sessions that helped inform Washington’s Environmental Health Disparities Map. This report demonstrates the planning, strategy, and findings from those listening sessions.